|
Debugging in Internet Explorer
By default, JavaScript errors are ignored by Internet
Explorer. In order to be able to debug in Internet Explorer, you need to:
1. Start Internet Explorer and go
to Tools
| Internet Options | Advanced and clear the Disable
script debugging (Internet Explorer) and Disable
script debugging (Other) checkboxes. If you want a pop-up window to be
displayed for each error, you need to check the Display
a notification about every script error checkbox, as shown:
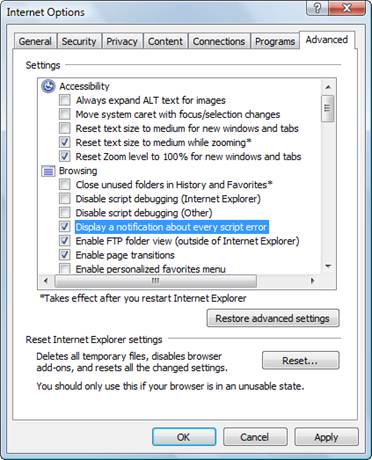
Enabling
debugging in Internet Explorer
2. Open the solution you want to
debug in Visual Studio.
3. Execute the project.
4. After the Internet Explorer
window opens, go back to Visual Studio.
5. Open the script explorer by
going to Debug
| Windows | Script Explorer. The script explorer will list the available
script files that can be debugged
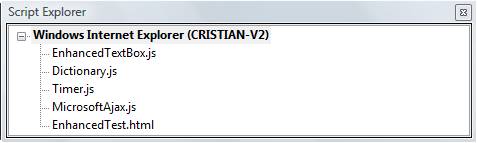
Using the IE
script explorer
6. Double-clicking a file in the
script explorer will open it in the editor. There you can place breakpoints
inside JavaScript files, and the feature will work just as it does when
debugging server-side code.
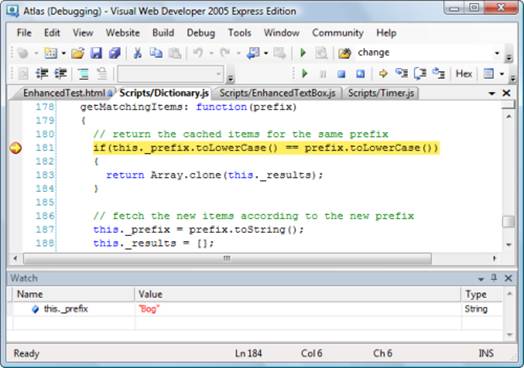
Debugging
JavaScript code using Visual Studio
Alternatively, if you have Visual Studio, you can attach
the debugger to an existing the Internet Explorer process by selecting Debug
| Attach to Process, and then choosing the Internet Explorer process
(iexplore.exe).
If Internet Explorer is configured for debugging and a
script error is encountered in the browser while no debugger is attached, you’re
prompted to choose one of the available debuggers:
Ø
Visual Studio and Visual Web Developer 2005
Ø
Microsoft Script Debugger (downloadable from Microsoft’s website)
Ø
Microsoft Script Editor (ships with Microsoft Office)
For more about debugging web applications in Visual
Studio, see these links:
Web Development Helper
Web Development Helper is a great tool developed by
Nikhil Kothari and should be used by every developer who needs the following
development features:
Ø
HTTP(S) traffic monitoring
Ø
DOM inspector
Ø
Script errors and immediate window
Web Development Helper can
be downloaded from:
http://www.nikhilk.net/Project.WebDevHelper.aspx.
For more documentation about this tool, check the
following links:
- http://projects.nikhilk.net/WebDevHelper/Readme.pdf
- http://www.nikhilk.net/WebDevHelperDebuggingTools.aspx
- http://weblogs.asp.net/scottgu/archive/2006/11/13/Nikhil_2700_s-WebDevHelper-Utility-and-ASP.NET-AJAX-Support.aspx
When it comes to debugging, the tool offers nice
features such as showing the trace, catching run-time errors, and showing the
full call stack (including script URL, line number, and line of code). The Script
Console
window allows entering custom script that is executed within the document
context.
Internet Explorer Developer Toolbar
Microsoft offers the
Internet Explorer Developer toolbar as an option for exploring web pages. It is
especially useful for working with the page’s DOM element, CSS styles, cookies,
etc. It can be downloaded Microsoft’s web site.After it installs, you open it
through Tools | Toolbars | Explorer Bar | IE Developer
Toolbar.
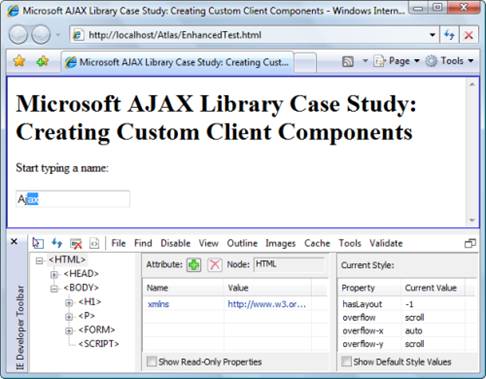
Internet
Explorer Developer Toolbar in action
It is worth mentioning that it doesn’t compete with
Nikhil’s tool, but it’s more like a complementary tool as it doesn’t offer
JavaScript debugging capabilities or any of the other main features by Web
Development Helper.
Other tools
There are other other tools that are worth mentioning
and that you should keep an eye on:
Ø Damian Meher’s TraceJS is a tool that logs every line of
script executed in Internet Explorer. Find it at http://damianblog.com/2006/11/23/tracejs/.
Ø Julien Couvreur’s XMLHttpRequest
debugging bookmarklet.
See http://blog.monstuff.com/archives/000291.html and http://weblogs.asp.net/bleroy/archive/2006/05/15/446532.aspx.
Debugging in Firefox
With the increasing number of users of Firefox, the
number of tools used for web development has grown as well.
First of all, Firefox offers an Error
Console accessible from the Tools
menu, where all the JavaScript errors, warnings, and messages are logged. It
also has a built-in script evaluator within the document context, and the DOM
Inspector tool, which can be selected at installation time, so we can say that
the features packaged into Firefox are quite advanced in comparison with the
default features of Internet Explorer. Below figure shows the Error Console
signalling a typo in our code.
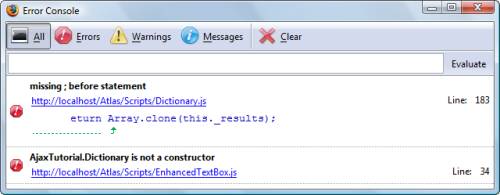
The Error
Console in Firefox
Firebug
Firebug (http://www.getfirebug.com/) is a
Firefox plugin that offers almost anything a web developer could want from a
debugging tool:
Ø
Debugging and profiling script
Ø
Monitoring HTTP traffic
Ø
Examining HTTP headers
Ø
Inspecting and editing the DOM
Ø
Inspecting and editing CSS
Ø
Quick search for filtering errors and messages
Delivering such a powerful set of tools in one free
product makes Firebug the perfect choice for debugging applications in Firefox.
Following figure shows Firebug in action.
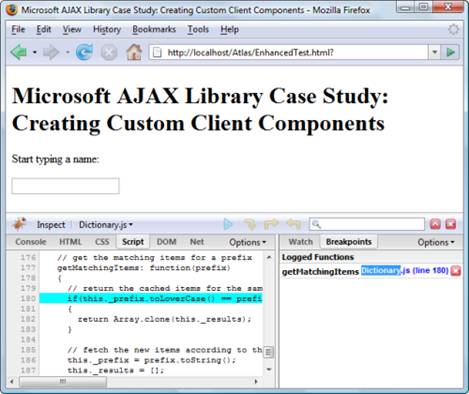
Debugging using
Firebug
Venkman JavaScript Debugger
The Venkman JavaScript debugger (http://www.mozilla.org/projects/venkman/)
is a powerful tool for debugging in Mozilla-based browsers (Firefox, Netscape,
and Seamonkey).
Like Firebug, Venkman JavaScript Debugger offers
debugging and profiling, full call stack, breakpoints, local variables, and
watches, all within an interface that is very similar to Visual Studio. See this
tool in action in figure below.
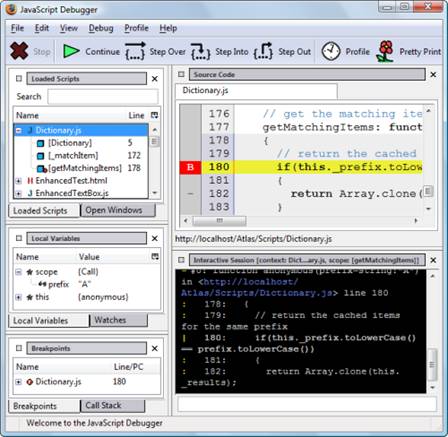
Debugging using
Venkman JavaScript Debugger
You can find a few excellent online articles for using
Venkman JavaScript Debugger:
Ø http://www.svendtofte.com/code/learning_venkman/
Ø http://www.hacksrus.com/~ginda/venkman/
Ø http://www.webreference.com/programming/javascript/venkman/
Web Developer
Similar to what Firebug and Internet Explorer Developer
Toolbar offer, Web Developer plugin (https://addons.mozilla.org/en-US/firefox/addon/60),
provides a most comprehensive set of tools for:
Ø
DOM information and inspection
Ø
Outlining different elements (frames, headings, tables, links,
etc.)
Ø
HTTP headers, JavaScript, images information
Ø
Cookies
Ø
CSS
Ø
Page validation (CSS, HTML, WAI, links, Section 508)
All in all, this extension
is a very good companion for developing websites. The homepage for this
extension and some documentation can be found at http://chrispederick.com/work/webdeveloper/.
Fiddler
When it comes to inspecting and tampering with the
HTTP(S) traffic from our computer and the Internet, the most popular tool you
can find is Fiddler. This is a freeware tool that allows inspecting all HTTP and
HTTPS traffic and tampering it, setting breakpoints, making it an ideal
candidate for debugging applications.
It also offers an event-based subscription system
offering the capability to easily extend it. Install Fiddler from http://www.fiddler2.com/Fiddler2/.
You can find a quick introduction to Fiddler on MSDN, and in the following
resources:
Ø Fiddler
tutorial http://www.developer.com/lang/jscript/article.php/3631066
Ø Fiddler2
demonstration videos http://www.fiddler2.com/fiddler/help/video/default.asp
Ø Fiddler2
extensions development http://www.fiddlertool.com/fiddler2/extensions.asp
Ø Fiddler2
user interface http://www.fiddler2.com/Fiddler/help/ui.asp
Testing
There are a lot of testing tools available today, but
only few of them allow for automatic testing of AJAX applications. Dan Wahlin
has put together a list of automated testing and debugging tools on his weblog
at http://weblogs.asp.net/dwahlin/
on 2007/02/16/.
In his article we can find some of the tools that we
presented so far, and also a comprehensive list of tools that we can use for
automatic testing.
A less documented feature of Fiddler is that it can
generate Visual Studio WebTest files that can be using in Visual Studio. Why is
this necessary? Visual Studio doesn’t record AJAX requests based on
XMLHttpRequest, but only full postbacks.
In order to create a Visual Studio WebTest file, you
need to follow these steps:
Ø
Open Fiddler.
Ø
Start capturing the traffic by pressing F12 or by
selecting File
| Capture Traffic.
Ø
Browse the AJAX application and Fiddler will register the
requests.
Ø
After having finished the steps save the session by going to File|
Save | Session(s) | as Visual Studio Web Test.
Ø
Now you can import the generated file in Visual Studio and use it
for automatic testing.
|